Basic Concepts#
Using Syncopy usually entails writing Python analysis scripts operating on a given list of data files. For new users we prepared a Quickstart with Syncopy. Here we want to present the general concepts behind Syncopy.
Data analysis pipelines are inspired by the well established and feature-rich MATLAB toolbox FieldTrip. Syncopy aims to emulate FieldTrip’s basic usage concepts.
General Workflow#
A typical analysis workflow with Syncopy might look like this:
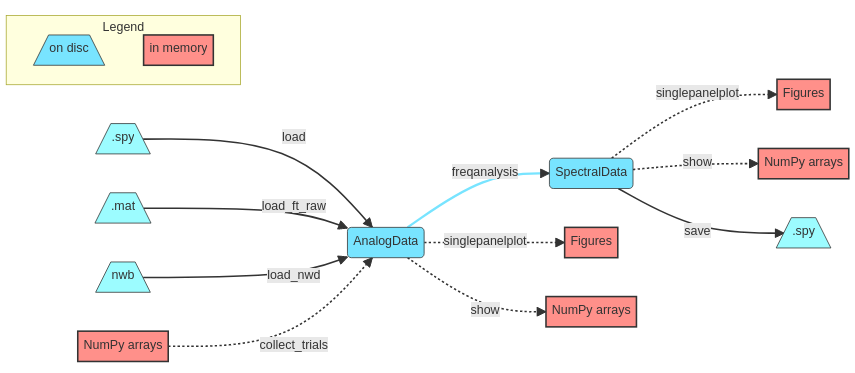
We start with data import (or simply loading if already in .spy format) which will create one of Syncopy’s dataypes like AnalogData. Then actual (parallel) processing of the data is triggered by calling a meta-function (see also below), for example freqanalysis(). An analysis output often results in a different datatype, e.g. SpectralData. All indicated methods (show(), singlepanelplot() and save()) for data access are available for all of Syncopy’s datatypes. Hence, at any processing step the data can be plotted, NumPy ndarray’s extracted or (intermediate) results saved to disc as .spy containers.
Note
Have a look at Data Basics for further details about Syncopy’s data formats and interfaces
Memory Management#
One of the key concepts of Syncopy is mindful computing resource management, especially keeping a low memory footprint. In the depicted workflow, data processed on disc is indicated in blue, whereas potentially memory exhausting operations are indicated in red. So care has to be taken when using show() or the plotting routines singlepanelplot() and multipanelplot(), as these potentially pipe the whole dataset into the systems memory. It is advised to either perform some averaging beforehand, or cautiously only selecting a few channels/trials for these operations.
Syncopy Meta-Functions#
All of Syncopy’s computing managers (like freqanalysis()) can be
either called using positional/keyword arguments following standard Python syntax,
e.g.,
spec = spy.freqanalysis(data, method="mtmfft", foilim=[1, 150], output="pow", taper="dpss", tapsmofrq=10)
or using a cfg configuration structure:
cfg = spy.get_defaults(spy.freqanalysis)
cfg.method = 'mtmfft';
cfg.foilim = [1, 150];
cfg.output = 'pow';
cfg.taper = 'dpss';
cfg.tapsmofrq = 10;
spec = spy.freqanalysis(cfg, data)